What is new in 1.2.0
Clusters you can fly into, and the edge of what we can see
Clusters became stars you can fly among in release 1.2.0, and two new trips take the same idea out to the edge of the universe we can see.
Release 1.2.0 · 27 October 2026 · about 4 minutes
A cluster used to be a smudge on the map: a glow with a label. Release 1.2.0 turned clusters into stars you can fly among, then took the same idea outward, to clusters of galaxies and to the edge of everything we can see. Along the way it added two journeys and a way to find your path home. Here is what each of them draws, and what it only suggests.
Globular clusters: a model of a kind
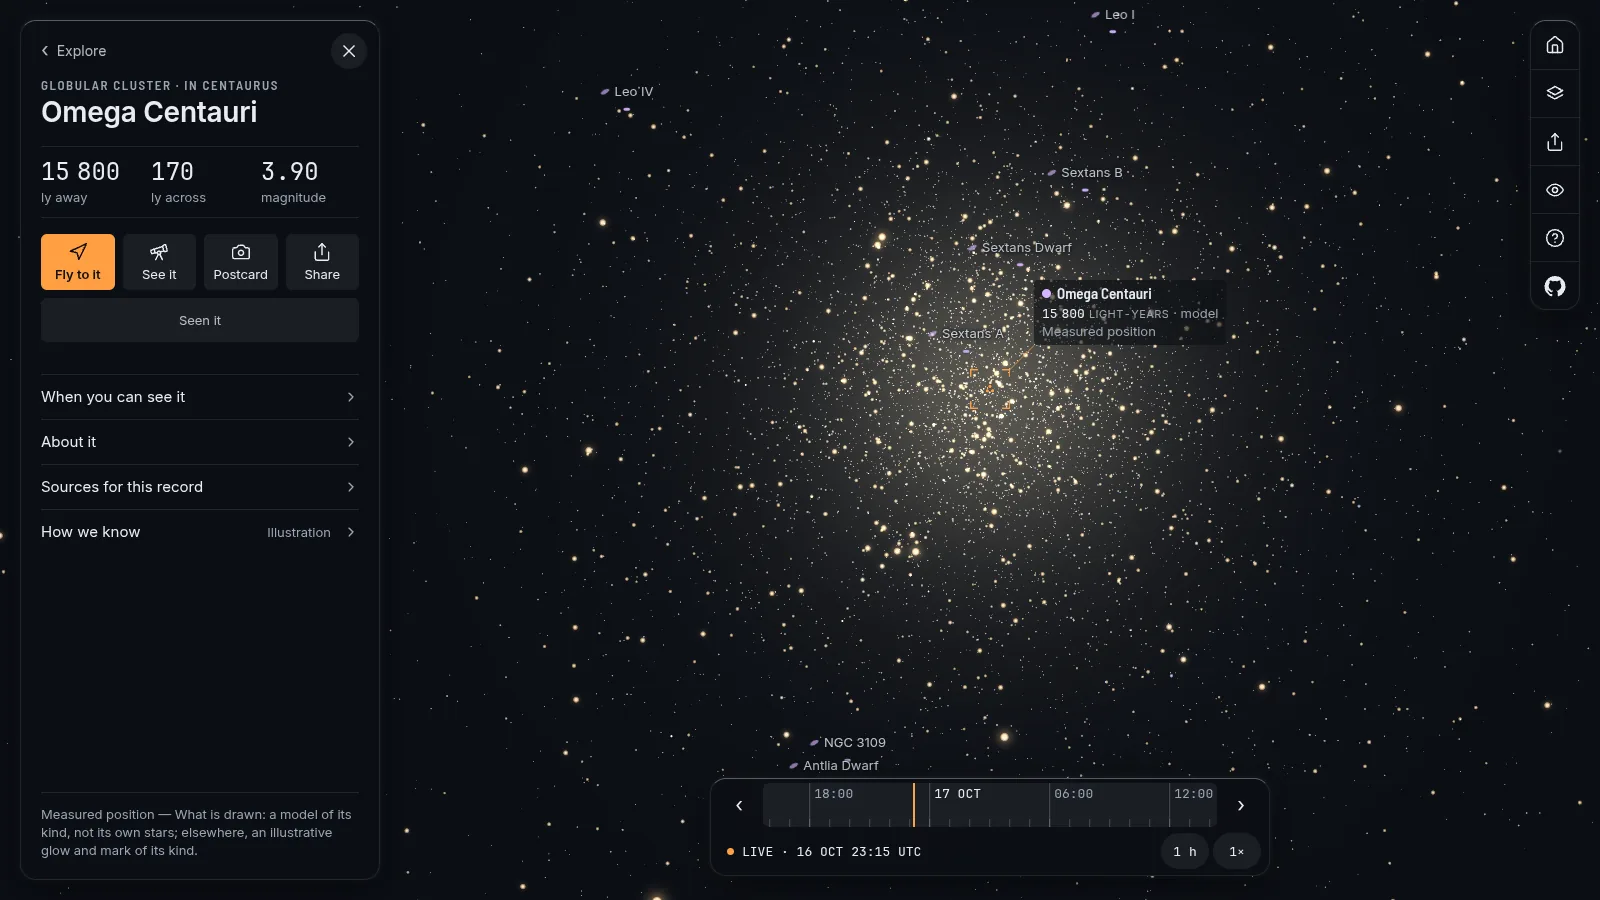
All 33 globular clusters on the map are now drawn as stars. The numbers come from one catalogue, Harris's 1996 list: each cluster's core radius and how concentrated it is, which together give a core and an edge in light-years. The stars are placed with King's 1962 formula for how such a ball thins out, dense in the core and fading to nothing at the edge.
What the map does not know is where each star is. So the positions, the number of stars shown and their brightnesses are a model, seeded by the cluster's name so that every visit draws the same stars. The colours are illustrative. A point is "one plausible giant", never a stand-in for a thousand stars, so from inside the outskirts you see what that many giants would make, not a wall of light. The glow of the fainter stars no point stands for is dimmed by exactly the light the points add.
Fly into Omega Centauri, 15,800 light-years away and about 170 across, and you will be inside a model of its kind. The card says "How we know: illustration".
Open clusters: their own stars
Open clusters are different. For 36 of them the map draws real stars: the members that Gaia measured, from the Hunt and Reffert 2023 census, kept when their membership probability is at least one half. That is 23,685 stars in all. Each keeps its measured direction on the sky. Its depth comes from its own parallax when that is precise enough, and otherwise from a seeded draw inside the cluster's measured size; the data says which, star by star. Nothing moves: no proper motion is drawn.
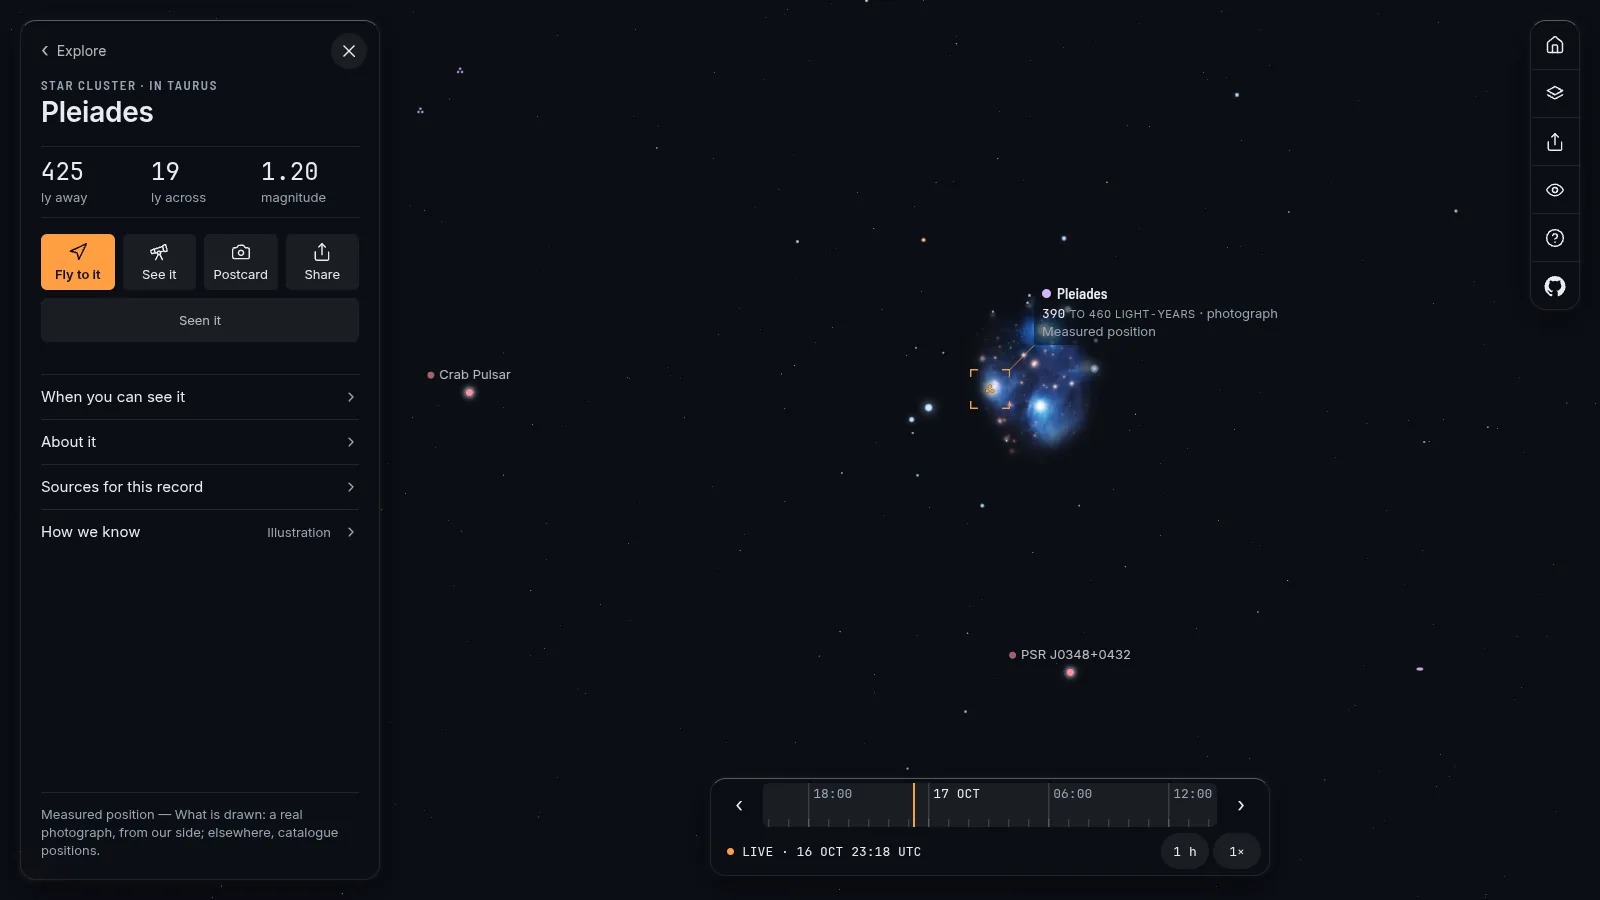
The Pleiades, the Hyades, the Beehive and the Southern Pleiades were already there, because their brightest stars are in the catalogue the map ships. The new stars fill in the fainter ones. Gaia's data carries a non-commercial licence (CC BY-NC 3.0 IGO) and the credits page says so.
Clusters of galaxies and two quasars
One step out, Virgo, Coma, Fornax and Perseus are drawn as swarms of their own galaxies: 3,596 of them, from VizieR tables and the Sloan Digital Sky Survey. Where a cluster's mean distance was measured from surface-brightness fluctuations, as for Virgo and Fornax, so was the spread in depth. For Coma and Perseus the depth is modelled from the spread on the sky, "because a cluster is round", and the registry says that this is an assumption.
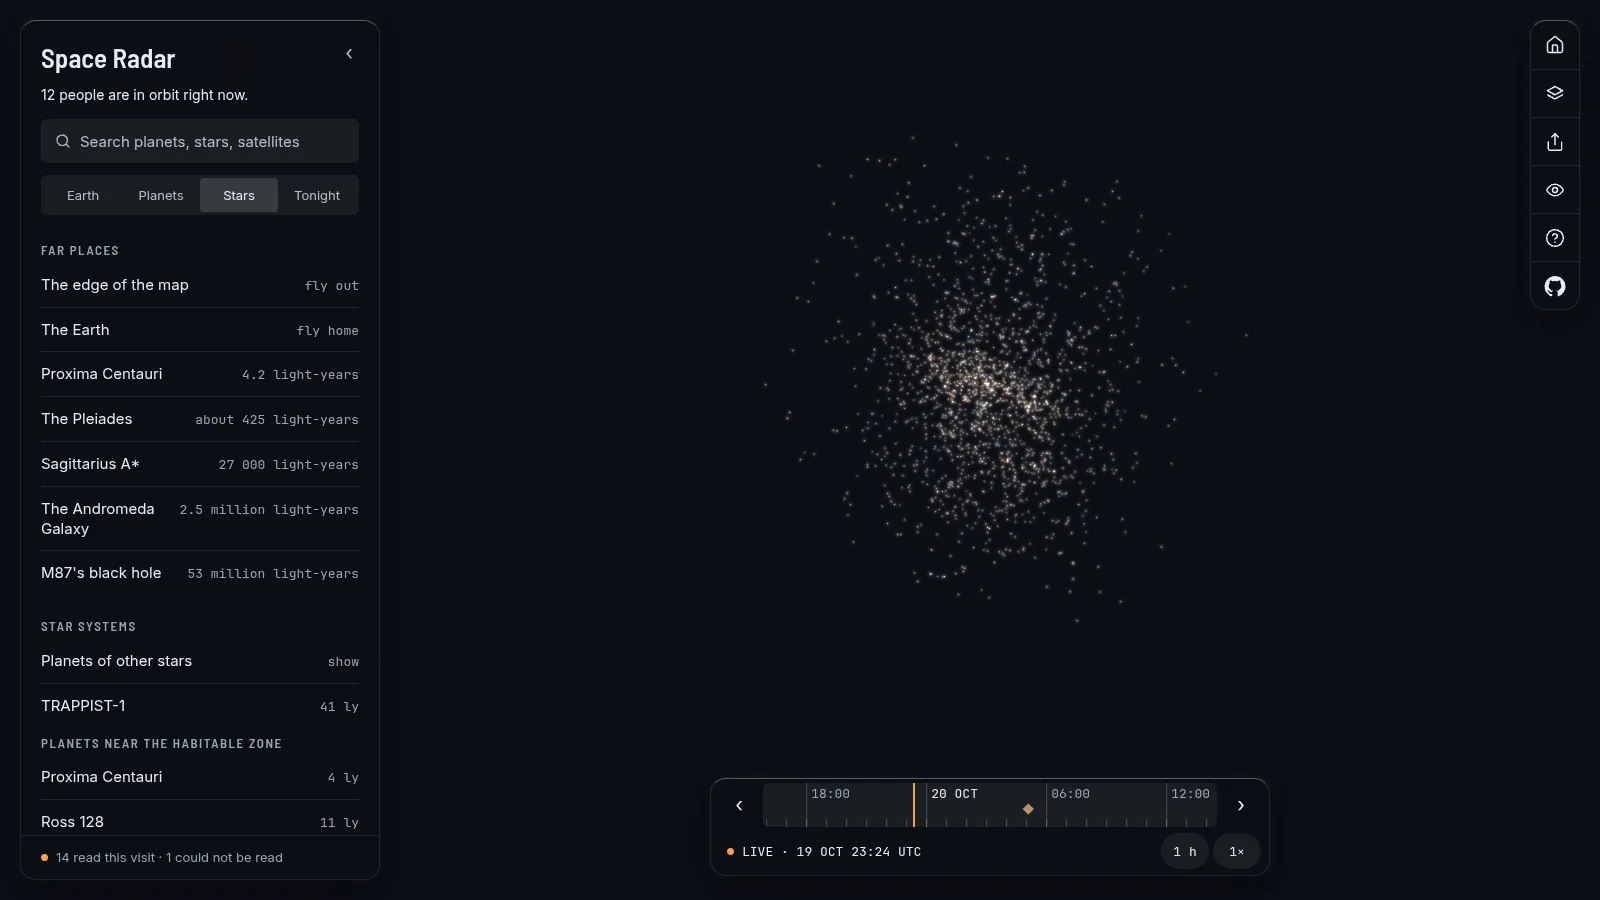
The quasars 3C 273 and 3C 279 appear as bright points at their distances in the map's one model of the universe: where space has carried them since their light set out, which is not the same as how long the light travelled.
Two journeys
Release 1.2.0 added two guided trips, each with a voice, captions, a share page and a copy that works offline.
Across the Local Group stops at the Milky Way seen from outside (a model: nobody has left it to look back), the Large Magellanic Cloud, Andromeda, Triangulum, and then the Local Group among 800 neighbours. Out to the edge of the universe we can see goes on from the local volume to the quasar TON 618, to the places the first galaxies are now (none is drawn), and to the oldest light. TON 618's stop explains the difference: its light left 10.8 billion years ago, and the map draws it where the model puts it now, about 18 billion light-years away.
The edge, with its scale
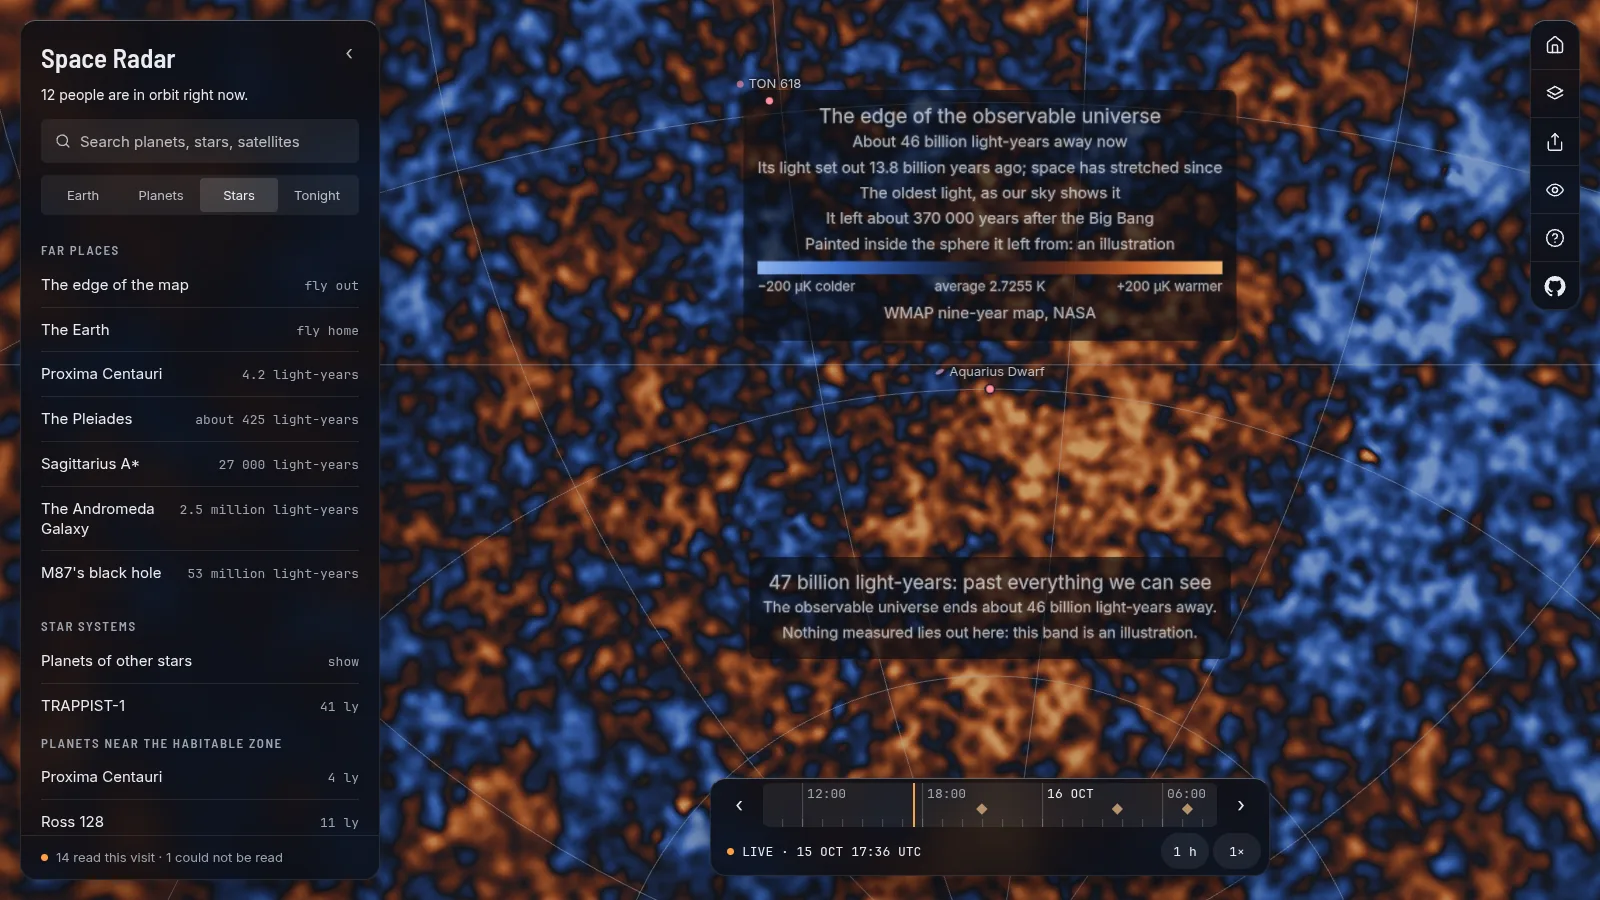
From about 30 billion light-years out the map paints WMAP's nine-year picture of the cosmic microwave background on the inside of a sphere 45 billion light-years away, just within the horizon, with a colour scale in microkelvin. The data are NASA's. Where it is painted is an illustration: the light was released about 370,000 years after the Big Bang, and from anywhere else in the universe the picture would differ. The map says that on screen, and a screen reader is given the same words. The ladder of scales now ends on a rung called Edge. What we can see ends at about 46 billion light-years, because farther light has not had time to reach us; nothing measured lies beyond it.
Finding your way back
Deep space is easy to get lost in. Every card now shows its parents (Sun, Jupiter, Europa) and each part is a button that flies there. A Back button walks your last 20 steps, in this session only; nothing is stored. Typing "galaxies", "nebulae" or "moons of Saturn" into search lists everything of that kind, grouped by class.
Measured, modelled, illustrative
- Measured: each cluster's place, its distance, the size Harris and Gaia give, the Gaia stars' directions, and WMAP's map.
- Modelled: the globular stars, the depth of some members, the depth of Coma and Perseus.
- Illustrative: star colours in globulars, and the microwave map's place on a sphere.
Fly there
Pictures and sources
Screenshots of Space Radar (MIT licence). Data: Harris 1996 and Hunt and Reffert 2023 through VizieR; Gaia DR3 (ESA, CC BY-NC 3.0 IGO); Kim and others 2014, Kang and others 2024 and 2025, Ferguson 1989, Mei and others 2007 for galaxy clusters; WMAP nine-year map (NASA). See CREDITS.md.
More long reads
- Orion, the Ring and the nebulae you can fly into (release 1.2.0)
- The Moon at a low Sun, the giants' rings and the plumes (release 1.2.0)
- Spacecraft that look like themselves (release 1.3.0)
- Galaxies, Carina and the Magellanic Cloud from their own numbers (release 1.3.0)
- All the long reads